A stock analysis platform that turns isolated figures into meaningful investment insights using the Financial X-Ray Framework.
Data. Context. Conclusions.
A 50-second overview of the research process and Financial X-Ray framework.
Instead of juggling dozens of metrics and conflicting signals, the Financial X-Ray highlights where a company's strengths, risks and valuation stand today.
Most dashboards overwhelm. Most analyst narratives simplify. Most stock tips skip financial correlations.
Business quality does not live in one metric –
it emerges from how financial health, capital allocation, growth and valuation interact.
The Financial X-Ray makes those interactions visible – clearly and consistently.
→ Learn more about us
Quickly understand whether a company is fundamentally attractive
See where a business is strong – and where risks may be hiding
Cut through earnings noise and conflicting financial metrics
Compare companies using one consistent rating framework
Make investment decisions with more structure and less guesswork
Build your portfolio and roast it!
The Inside Analyst selects stocks where fundamentals and value drift apart. Top stories are published on Substack.

.webp)
This AI business has improved significantly on key financial metrics. Yet the stock price declines. Here is how investors can position themselves now. The company supplies the physical infrastructure data centers need to operate (power management, cooling systems and related services). More powerful AI chips require more electricity and generate more heat, making this infrastructure increasingly important.
SEP 24 · THE INSIDE ANALYST
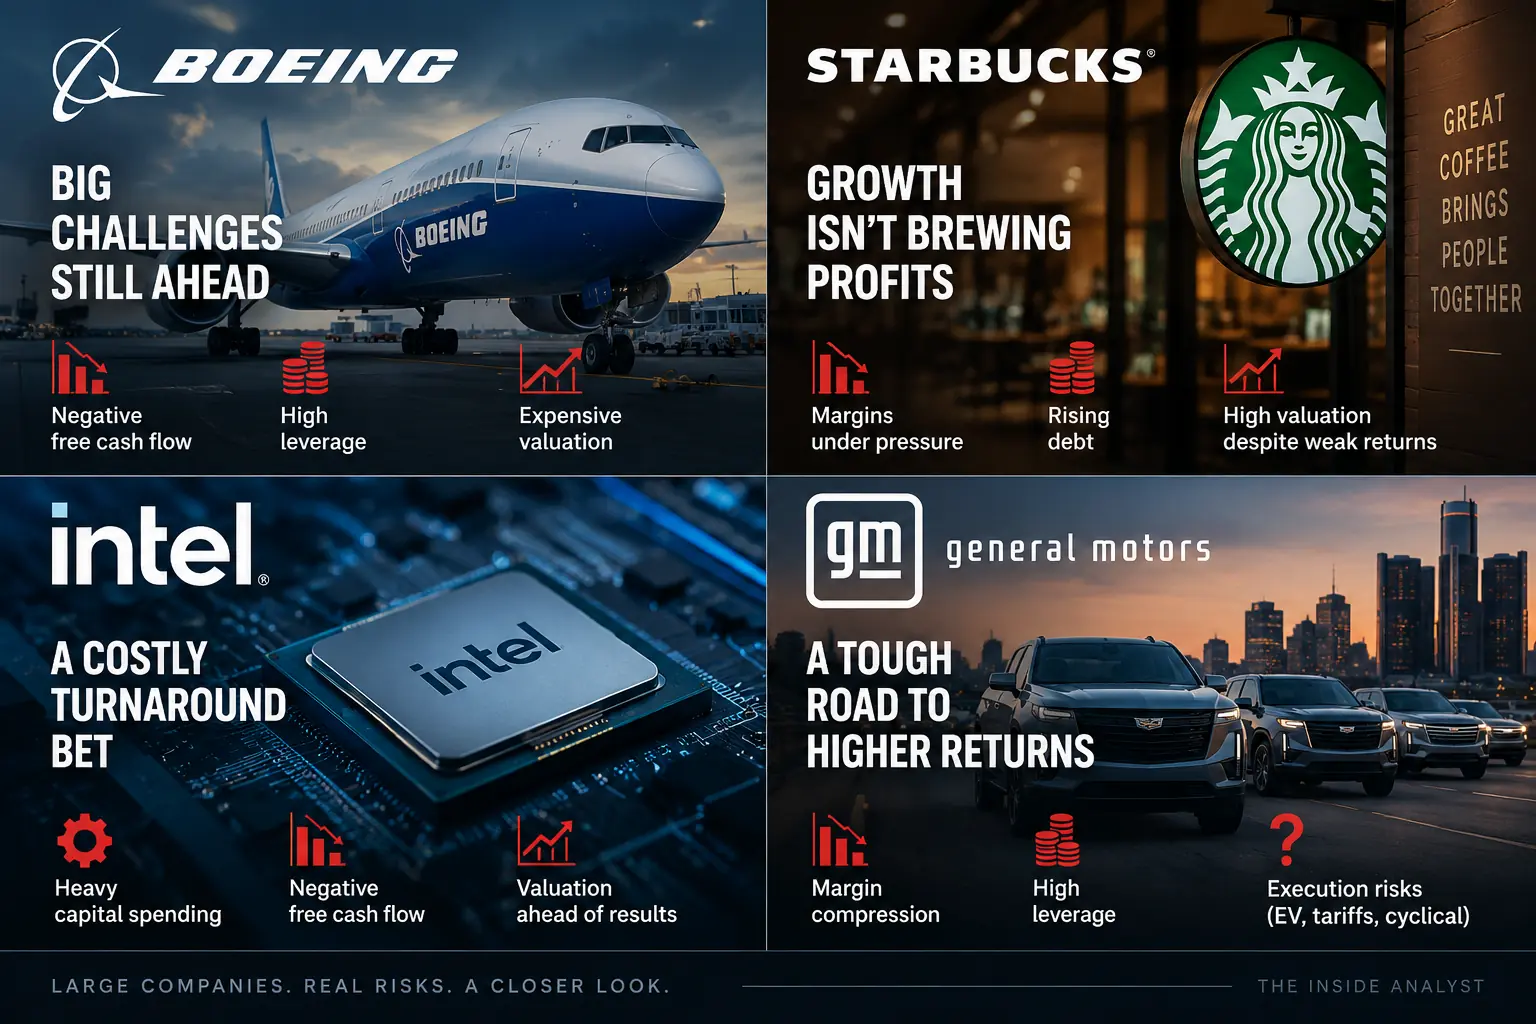
ETF’s are a great way to buy several equities at once. Transaction costs are limited, management fees are low and diversification is often guaranteed. For many private investors, these instruments are seen as the best way to invest if your time is limited.
SEP 21 · THE INSIDE ANALYST

Analysts must value Caterpillar according to a new growth regime: Demand accelerates and data-center power infrastructure creates a new growth engine.
SEP 28 · THE INSIDE ANALYST
Pick a stock and see structural strenghts and pain points in seconds.
Combining long-term fundamental investing with the Financial X-Ray framework to separate market expectations from business reality. ASML sits at the center of the global semiconductor industry, dominates a critical technology stack and continues to deliver strong growth, profitability and cash generation. Every advanced semiconductor – whether used in AI servers, smartphones, autonomous vehicles or data centres – must first be manufactured using lithography equipment, making ASML a critical supplier to the global chip industry. ASML makes money in two ways: Net Bookings of hardware sales (i.e. lithography machines), and Installed Base Management (regular updates and software services). The former makes up about 2/3 of revenues, while the latter represents about 1/3 of total revenues. This is a crucial distinction because the former represents lumpy machinery sales, while the latter is a smooth, recurring revenue stream that turns over come rain or shine.
JUL 3 · THE INSIDE ANALYST
The Financial X-Ray highlights an extraordinary business whose future still depends on maintaining exceptional conditions. NVIDIA’s financial transformation has been extraordinary.Revenue increased from just $11 billion in 2020 to more than $215 billion in 2026. EBITDA margins expanded from 31% to almost 67%, while free cash flow exceeded $95 billion. Return on invested capital climbed above 55% and the company now operates with virtually no net debt. Few companies have ever combined this level of growth, profitability and capital efficiency. Yet one characteristic has become even more pronounced. Nearly 90% of NVIDIA’s revenue now comes from its Data Center business. The company has become financially stronger than ever. It has also become more dependent on one extraordinary source of demand.
JUN 29 · THE INSIDE ANALYST
Want to receive top stories by email? Subscribe on Substack
.webp)






.webp)
.webp)